
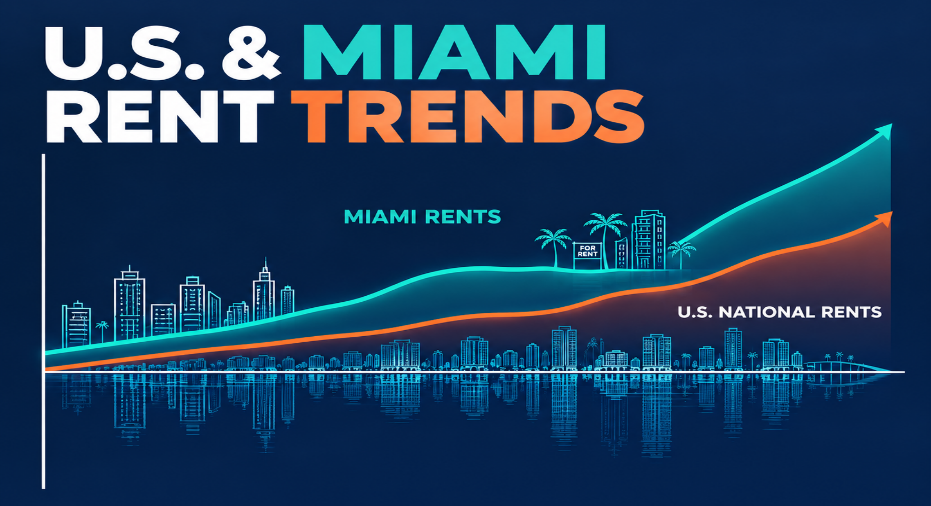
U.S. rents have gone through two different phases since 2019, a rapid increase from before COVID to 2022, followed by a pullback that still leaves rents higher than before the surge.
At Suma Property Management, we wanted to see how those same phases played out across 30 large U.S. metros, for different property types, and what an investor who bought in 2019 or in 2022 would be earning today. Miami gets most of our focus, because that is where we operate.
Nationally, median asking rent on new rental listings rose 27.3% from the third quarter of 2019 to the third quarter of 2022, then fell 10.8% by the third quarter of 2026, which leaves it 13.5% higher than before the surge.
In the Miami metro (Miami–Fort Lauderdale–Pompano Beach), the median asking rent on a new rental listing averaged $1,934 a month in the third quarter of 2019, $2,857 in the third quarter of 2022 and $2,669 in the third quarter of 2026. That is a 48% increase in three years followed by a 7% pullback, smaller than the country's, and it leaves Miami 38% above where it started, the largest gain of the 30 metros. It also ranks sixth of the 30 metros on median asking rent, up from eighth in 2019.
The data we used
For this analysis we used Parcl Labs, a data provider that aggregates data from many real estate sources and standardizes it at the property level. We used median asking rent on new rental listings, for single-family, condo and townhouse separately as our measure. It is what landlords are asking from new tenants, so it moves faster than the rent on a signed lease.
Every city in this article means its metro area, as Parcl defines it. "U.S." is Parcl's national figure. The 30 metros are listed in the notes.
Why Q3 2019, Q3 2022 and Q3 2026
We anchored the comparison on three points in time, the third quarter of 2019 (before COVID, our baseline), the third quarter of 2022 (the peak for U.S. rents) and the third quarter of 2026 (now). Each figure is the average of the July, August and September medians, which smooths out month-to-month noise. Metros are measured at the same three quarters, which keeps the comparison like for like.
The increase in rent levels followed the pandemic, which changed where and how people wanted to live while cheap money added fuel. The reset came as new apartment supply outran demand; Redfin said in July 2025 that apartment construction was near a 50-year high, leaving many units vacant (Redfin).
The country saw a rapid increase, then a reset
Across the 30 metros, the reset was broad, with 22 showing lower rent in Q3 2026 than in Q3 2022 and eight showing higher.
Metros differed in the size of the swings. Phoenix rose 37.4% and then fell 16.6%, while Chicago and Cleveland rose about 28% and kept rising after Q3 2022 (+4.7% and +5.9%). Only Austin and Dallas-Fort Worth sit below their Q3 2019 rent.
Where Miami stands
Across all property types, Miami moved from the eighth-highest rent of the 30 metros in Q3 2019 to the sixth-highest in Q3 2026, despite the pullback since Q3 2022. The chart shows where all 30 metros sat at each of the three points.
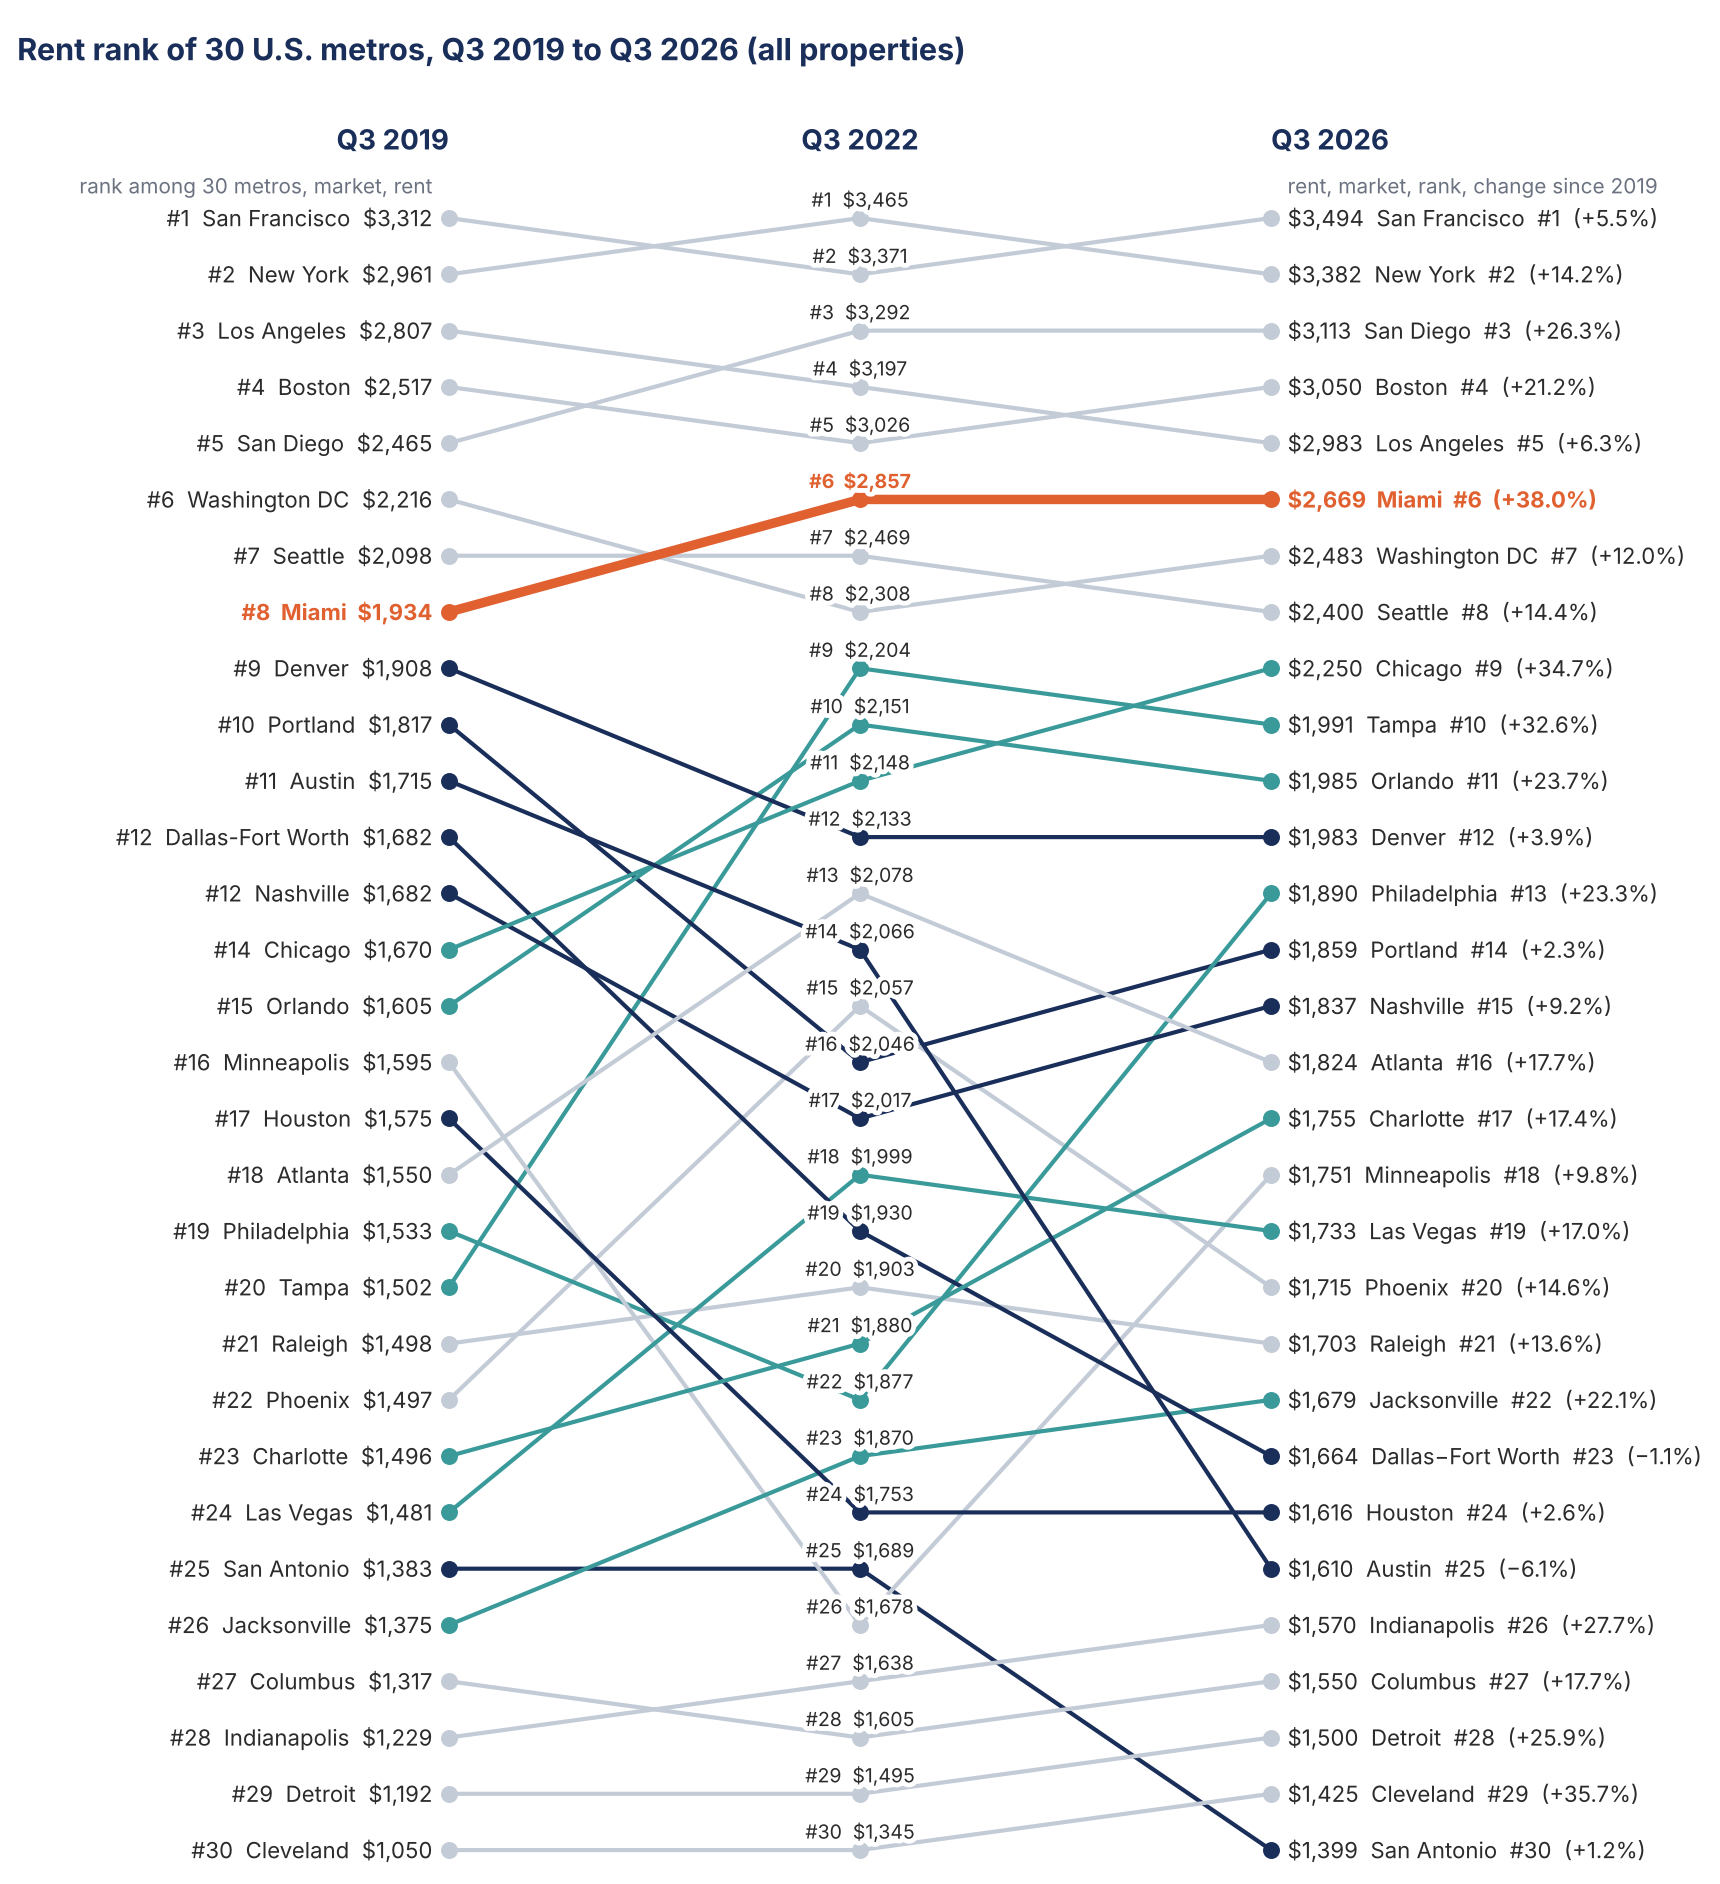
Rank by median asking rent on new rental listings among 30 metros, all property types, Q3 2019, Q3 2022 and Q3 2026 (Q3 is the mean of the July, August and September medians). Source: Parcl Labs, market metrics; our calculations.
Cut by property type, because the property mix matters
If a metro adds more large single-family listings in a year, its all-property median can rise even if no single home got more expensive. That is why we also look at the data by property type, which reduces most of that effect.
Property type | Miami rent, Q3 2026 (rank of 30) | Growth since 2019 (rank of 30) | U.S. Growth since 2019 |
All | $2,669 (#6) | +38.0% (#1) | +13.5% |
Single-family | $3,133 (#6) | +40.6% (#2) | +24.5% |
Condo | $2,575 (#6) | +39.2% (#1) | +6.6% |
Townhouse | $2,800 (#7) | +46.2% (#2) | +19.5% |
Median asking rent on new rental listings; Q3 averages; rent level and change in rent, each with rank among 30 metros in parentheses. Source: Parcl Labs, market metrics; our calculations.
You may notice that Miami's all-property growth is lower than each type's. That is a mix effect, driven by condos renting for less than the other types and making up most of Miami's new rental listings, which weighs down the all-property median.
Miami is in the top two for every type. Condo is first, single-family and townhouse second, so Miami's strength shows up in every type.
Four metros are in the top five of 30 for rent increase since 2019 in all three types. They are Miami, Tampa, Chicago and Indianapolis.
Condos corrected the most. Since Q3 2022, U.S. condo rent has fallen 13.4%, against 6.4% for single-family and 8.2% for townhouses. Condo rents fell in 21 of the 30 metros, against 17 for the other two types. Only Austin condos sit below their Q3 2019 rent.
Through an investor's eyes
Rent is half of an investor's picture, and the other half is what you paid. Many factors drive a property's profitability, so we use gross yield, annual rent divided by the purchase price, as a high-level proxy. It is not perfect, because it leaves out expenses that are specific to each property, but it is a good common starting point. To calculate it, we paired median sale prices with median asking rents.
For each entry point we take today's median asking rent (Q3 2026 average) times 12 and divide it by the median sale price in the quarter the investor bought (Q3 2019 or Q3 2022). So, if you bought at the median then, and your unit now rents at today's median, what gross yield do you earn on what you paid? The last column is the same math for someone buying now.
Metro | Bought Q3 2019 | Bought Q3 2022 | Buying Q3 2026 |
U.S. national | 9.4% | 6.9% | 6.4% |
Cleveland | 12.4% (#1) | 9.5% (#1) | 7.3% (#1) |
Miami | 11.4% (#2) | 7.8% (#4) | 6.5% (#5) |
Chicago | 11.4% (#3) | 9.2% (#2) | 7.2% (#2) |
Tampa | 10.8% (#4) | 6.7% (#7) | 6.8% (#3) |
Indianapolis | 10.4% (#5) | 7.1% (#6) | 6.6% (#4) |
Seattle | 5.9% (#26) | 4.3% (#25) | 4.2% (#25) |
Portland | 5.6% (#27) | 4.2% (#26) | 4.2% (#26) |
Denver | 5.6% (#28) | 4.1% (#27) | 4.1% (#28) |
Los Angeles | 5.3% (#29) | 4.1% (#28) | 3.7% (#30) |
San Francisco | 4.7% (#30) | 3.9% (#29) | 3.7% (#29) |
Gross yield = Q3 2026 median asking rent × 12 ÷ median sale price in the entry quarter (Q3 averages), all property types, with rank among 30 metros. Green: top five metros by 2019 yield; orange: bottom five; blue: U.S. national. Source: Parcl Labs, market metrics; our calculations.
The entry point matters heavily for yield. In the Miami metro the median sale price rose 76% from Q3 2019 to Q3 2026, from about $281,000 to about $495,000. Rent rose 38%. In all 30 metros, prices rose more than rents. That is why the same rent earns 11.4% on a 2019 purchase and 6.5% on a 2026 one.
Borrowing costs moved too. The 30-year fixed mortgage rate is averaging more than 7% in October 2026, against a record low of 2.65% in January 2021 (Freddie Mac). Those days are long gone.
Let's take a look at Miami metro by property type.
Property type | Miami: bought 2019 | Miami: bought 2022 | Miami: buying 2026 | U.S.: 2019 | U.S.: 2022 | U.S.: 2026 |
All | 11.4% (#2) | 7.8% (#4) | 6.5% (#5) | 9.4% | 6.9% | 6.4% |
Single-family | 11.8% (#2) | 7.9% (#3) | 6.8% (#8) | 10.2% | 7.5% | 6.9% |
Condo | 13.9% (#2) | 9.2% (#3) | 8.0% (#1) | 9.6% | 7.3% | 6.5% |
Townhouse | 12.8% (#3) | 8.4% (#4) | 7.7% (#3) | 10.0% | 7.3% | 6.9% |
Same method by property type; rank among 30 metros in parentheses. As with rent growth, the all-property yield sits below each type's, a mix effect from pooling property types. Source: Parcl Labs, market metrics; our calculations.
Miami condos have the highest gross yield of the 30 metros today, at 8.0%. A gross yield leaves out HOA dues, which are where condos differ most from single-family homes. Compare condos after costs, not before.
Treat these numbers as directional. Rent comes from rental listings and price from completed sales, which are different pools of homes. An owner with a long-term tenant may not be at today's market rent. And a higher yield is not automatically a better investment.
Know your numbers
Miami held its rent better than the country did, with a smaller pullback and the biggest gain since 2019 of the 30 metros. But prices rose faster than rents, so most of that gain went to owners who bought early. That does not make real estate a poor investment today. It just takes more work to find the right opportunity.
Rental investing is a long game, and the market keeps moving under a property you already own. The key is to understand what your unit earns today and its future potential for both cash flow generation and price appreciation.
At Suma Property Management, we manage residential rentals only in Miami-Dade County, so the comparisons we run for an owner are local. At each renewal we propose a rent based on comparable listings and the condition of the property, and the owner makes the final call. We sit down with our clients to review how the property is performing as an investment and how it fits their overall situation. If you would like a second set of eyes on your own property, we are happy to run the numbers with you.
This article is education, not financial, tax or legal advice. Talk to your CPA and an attorney before making decisions about your property.
Data sources and notes
Data as of October 2026.
Sources
Parcl Labs, market metrics: median asking rent on new rental listings and median sale price of completed sales, by month, for 30 large U.S. metros and the U.S. national figure, for all property types and for single-family, condo and townhouse. Quarter figures use July, August and September of 2019, 2022 and 2026; the U.S. and Miami monthly series run from July 2019 to September 2026. Parcl says it aggregates data from many real estate sources and standardizes it at the property level.
Freddie Mac, Primary Mortgage Market Survey: 30-year fixed-rate average, 7.32% for the week of October 22, 2026; and Freddie Mac release of January 7, 2021: 2.65%, a record low for the survey.
Redfin press release of July 9, 2025: apartment supply and construction levels.
All rankings, percentage changes, averages and yields are our own calculations from the Parcl figures. They are illustrations, not forecasts.
Notes on the data used
Asking rents on new listings. They are not signed leases. Existing tenants usually pay less than a new listing asks, and they adjust more slowly.
Medians reflect mix. A median changes when the mix of homes listed changes. We cut by property type to reduce this, but cannot remove it.
Metro definition. Every city here is a metro area as Parcl defines it. The 30 metros, by Parcl's names: Atlanta-Sandy Springs-Alpharetta, GA; Austin-Round Rock-Georgetown, TX; Boston-Cambridge-Newton, MA-NH; Charlotte-Concord-Gastonia, NC-SC; Chicago-Naperville-Elgin, IL-IN-WI; Cleveland-Elyria, OH; Columbus, OH; Dallas-Fort Worth-Arlington, TX; Denver-Aurora-Lakewood, CO; Detroit-Warren-Dearborn, MI; Houston-The Woodlands-Sugar Land, TX; Indianapolis-Carmel-Anderson, IN; Jacksonville, FL; Las Vegas-Henderson-Paradise, NV; Los Angeles-Long Beach-Anaheim, CA; Miami-Fort Lauderdale-Pompano Beach, FL; Minneapolis-St. Paul-Bloomington, MN-WI; Nashville-Davidson--Murfreesboro--Franklin, TN; New York-Newark-Jersey City, NY-NJ-PA; Orlando-Kissimmee-Sanford, FL; Philadelphia-Camden-Wilmington, PA-NJ-DE-MD; Phoenix-Mesa-Chandler, AZ; Portland-Vancouver-Hillsboro, OR-WA; Raleigh-Cary, NC; San Antonio-New Braunfels, TX; San Diego-Chula Vista-Carlsbad, CA; San Francisco-Oakland-Berkeley, CA; Seattle-Tacoma-Bellevue, WA; Tampa-St. Petersburg-Clearwater, FL; Washington-Arlington-Alexandria, DC-VA-MD-WV.
Quarter averages. We averaged July, August and September for 2019, 2022 and 2026.
Small samples by type. Single-type medians in smaller metros may rest on few listings. Read patterns, not decimals.
Gross yields. They use rent from rental listings and price from completed sales, which are different pools of homes. They exclude vacancy, taxes, insurance, HOA dues and special assessments, management and repairs, and they assume rent at today's market median.